Vaca Muerta Correlation Module
Esta página aún no está disponible en tu idioma.
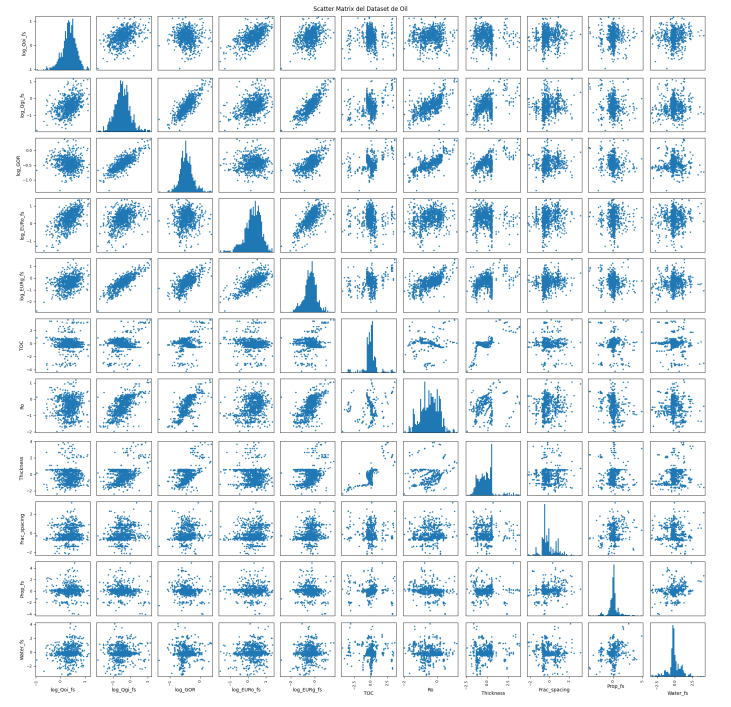
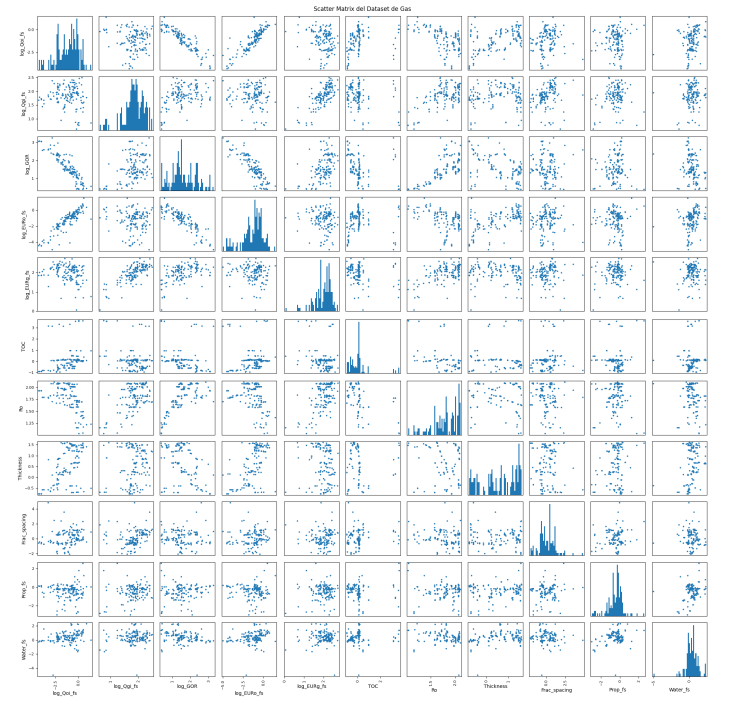
The Vaca Muerta Correlation Module estimates critical production variables (GOR, Initial Rates, and EUR) based on standardized correlations, primarily using Vitrinite Reflectance (Ro) as the predictor variable. The model has been calibrated using a filtered dataset from the Neuquina Basin (Vaca Muerta formation).
1. General Description
This module allows the user to generate production estimates by correlating geological parameters with historical performance. It is designed to fill data gaps where direct measurements may be missing, using a statistical approach derived from horizontal wells in the Vaca Muerta formation.
2. Data Selection Criteria (Model Basis)
The module was trained using a historical dataset filtered under specific criteria. It is important to consider these constraints when validating the model’s applicability to new wells:
- Basin/Formation: Neuquina / Vaca Muerta.
- Geometry: Horizontal.
- Start Date: Wells started from January 2018 onwards (to ensure representativeness).
- Production Time: Greater than 365 days.
- Lateral Length: More than 1000 m (short or null laterals were removed).
3. Input Processing
3.1 Cleaning and GOR Definition
The system uses a standardized definition for Initial GOR:
- It is calculated as the cumulative GOR at 180 days.
- Formula: $GOR_{acum\cdot180d} = \frac{Gp_{acum\cdot180d}}{Np_{acum\cdot180d}}$
3.2 Variable Normalization
Before processing, the module calculates 14 normalized variables derived from the input data:
- Proppant per fracture stage.
- Water injected per fracture stage.
- Thickness times TOC.
- Fracture stages times Ro.
- Log10(Oil peak rate).
- Log10(Gas peak rate).
- Log10(Oil peak rate per stage).
- Log10(Gas peak rate per stage).
- Oil EUR per stage.
- Gas EUR per stage.
- Log10(Oil EUR).
- Log10(Gas EUR).
- Log10(Oil EUR per stage).
- Log10(Gas EUR per stage).
3.3 Standardization (Z-Score Calculation)
To enter the correlation curves, all variables are standardized to be on the same order of magnitude.
- Formula: $z_{i} = \frac{x_{i} - \mu_{x}}{\sigma_{x}}$
- Where $\mu_{x}$ is the mean and $\sigma_{x}$ is the standard deviation of the variable in the base dataset.
Standardization logic applied to input variables
4. Correlation Models (Core Logic)
The module estimates five main variables by correlating them with Standardized Ro.
A. GOR (Gas Oil Ratio)
- Relationship: Higher Ro correlates to higher GOR.
- Behavior:
- Oil Zone: Low error, smooth variations.
- Gas Zone (Ro close to 2): Potential for higher error due to the vertical asymptote.
B. Initial Oil Rate (Qoi) per Stage
- Behavior:
- Oil Range: Remains constant (horizontal asymptote).
- Gas Range: Decreases as Ro increases.
C. Initial Gas Rate (Qgi) per Stage
- Relationship: Visually linear.
D. Oil EUR per Stage
- Behavior: Decreases at lower Ro (heavier oils have higher decline) and also decreases in the gas window.
E. Gas EUR per Stage
Oil Matrix
Gas Matrix
5. Module Output
For each estimated variable, the module does not only return the mean value but also calculates uncertainty ranges based on the dispersion fit of the original data points:
- P90 Value: Conservative scenario.
- P10 Value: Optimistic scenario.
- Adjusted Correlation/P50: Mean value predicted by the curve.