Deterministic economic evaluation Feature description
This feature allows the user to run deterministic economic evaluations over a case. Each case can contain one or more wells + forecasts, type wells, consolidations or development plans. The feature is located in the ‘Economic’ tab, in the ‘Economic Evaluation’ navbar section.

User workflow
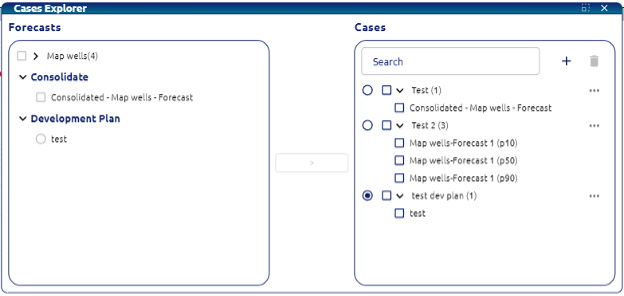
User must select a case in the Case Explorer. Then user must click on the Deterministic button. There are two cases the first case scenario is the economic evaluation of single wells or a consolidate production. The second case scenario is the economic evaluation of a Development plan previously calculated in the Dev Plan module of Dash.
Single well/Consolidate production scenario
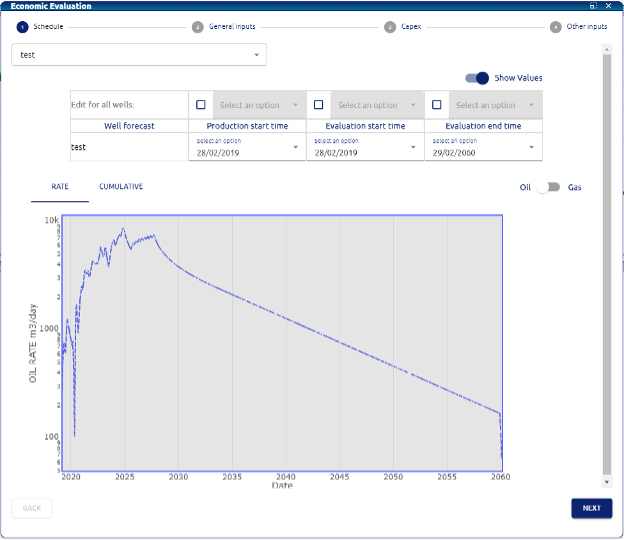
The first menu will allow the user to select and modify three main parameters:
• Production start time: date when the production is going to be taken into consideration for the evaluation.
• Evaluation start time: date when the evaluation is going to be calculated from.
• Evaluation end time: date when the evaluation should stop.
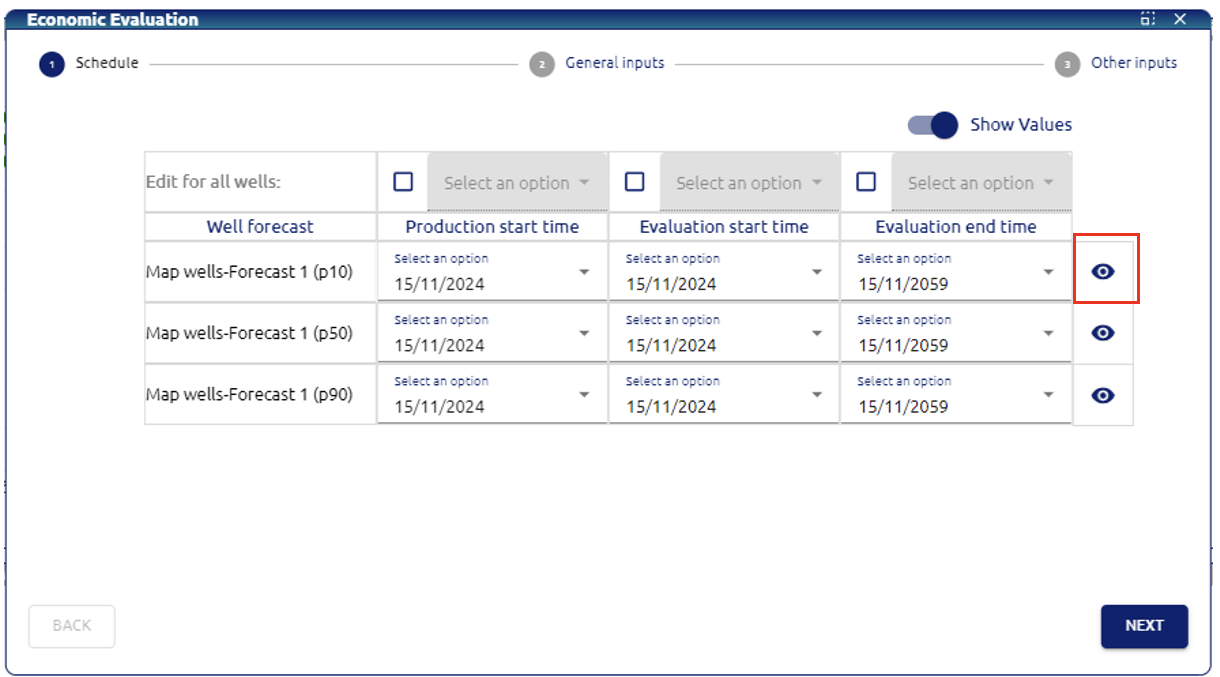
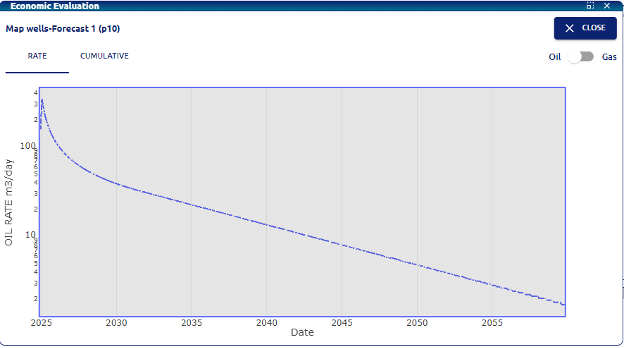
User can click on the “eye” button to look into the production curve of the selected well and can switch from oil to gas phase, rate or cumulative
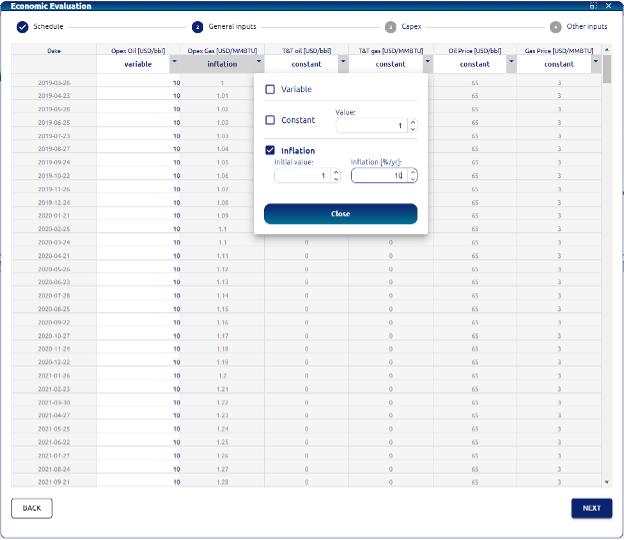
Next menu will be the general inputs that change over time:
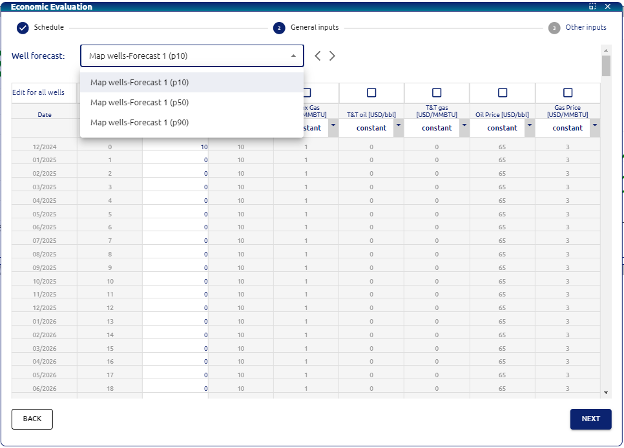
• Date: date column of the evaluation.
• Time period: time period of each step.
• Opex Oil: opex assigned to the oil production [USD/bbl].
• Opex Gas: opex assigned to the gas production [USD/MMBTU].
• T&T oil: treatment and transportation costs assigned to the oil production [USD/bbl].
• T&T gas: treatment and transportation costs assigned to the gas production [USD/MMBTU].
• Oil price: oil price for each period [USD/bbl].
• Gas price: gas price for each period [USD/MMBTU].
User can use the checkboxes for each variable to apply the same values for all wells.
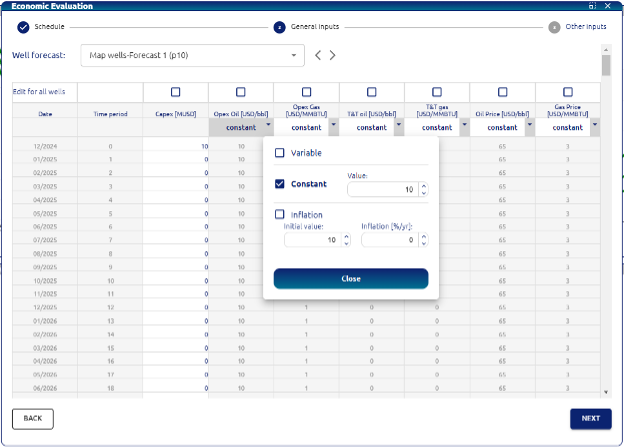
There are three options to modify each variable:
• Variable: user can load manually the values and/or copy paste.
• Constant: assign a constant value for the variable.
• Inflation: assign annual inflation value for the variables initial value.
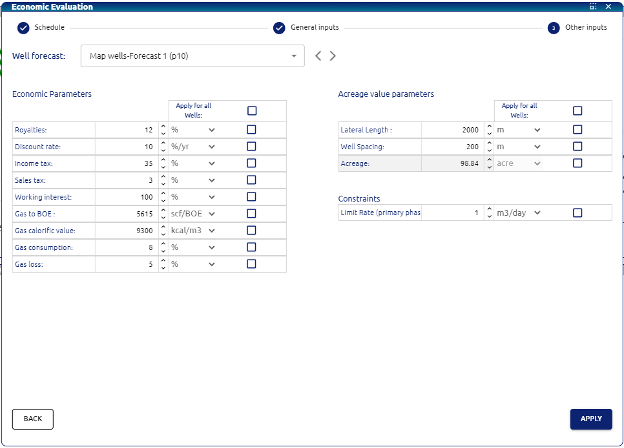
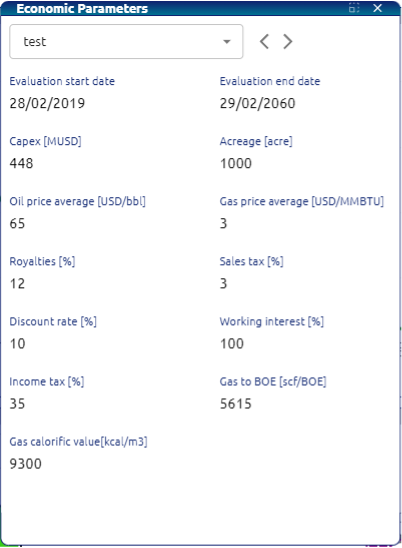
The last menu is the Economic parameters configuration, acreage value parameters and constraints:
• Royalties : Royalties for the case scenario.
• Discount rate: used for the calculation of the discounted cashflow and NPV.
• Income tax: Income tax applied to the scenario.
• Sales tax: Sales tax applied to the scenario.
• Working interest: Working interest of the scenario.
• Gas to BOE: Conversion factor used to calculate BOEs from gas volume.
• Gas calorific value: Rate of conversion for the normalization of gas calorific value.
• Gas consumption: percentage of the produced gas assigned for consumption of the field and is not monetized.
• Gas loss: percentage of the produced gas that is not monetized nor consumed.
• Lateral length: Average lateral length for the wells to calculate an estimated acreage created for each well being evaluated.
• Well spacing: Average spacing for the wells to calculate an estimated acreage created for each well being evaluated.
• Limit rate (primary phase): limit rate for the primary phase for the economic evaluation.
Once user defines the previous parameters, if they click apply the calculations will be held and results will be shown in the main layout.
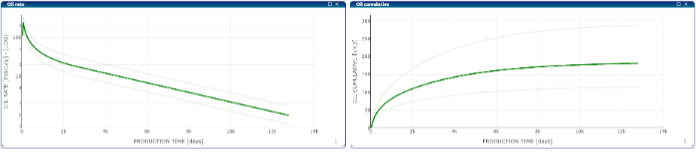
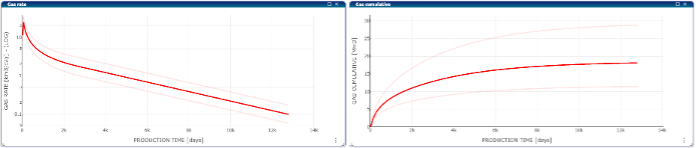
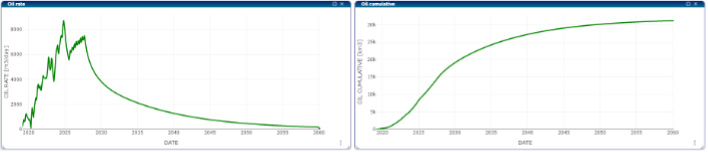
Oil and Gas Layout: Firstly, the user can see the oil rate and oil cumulative (Oil layout) or the gas rate and gas cumulative (Gas layout)
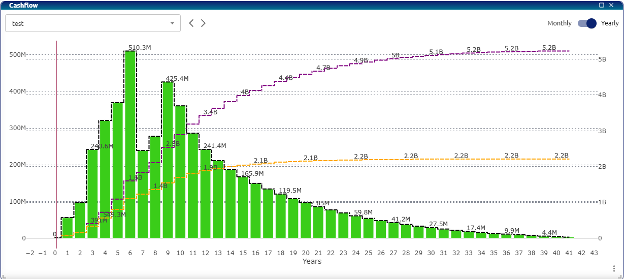
Cashflow:
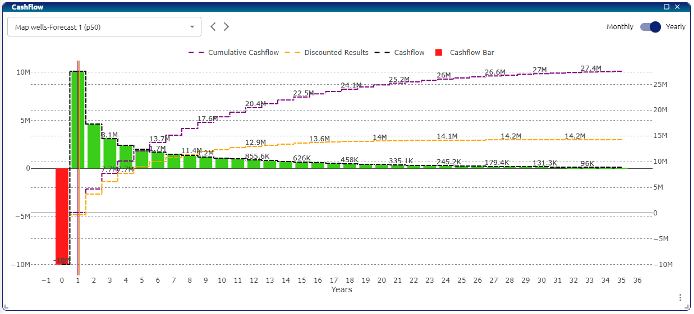
The cashflow plot shows a column for each period of time with the cashflow, if the bar is red the value is negative, if it is positive, it is green. There are two lines, the orange line is the cumulative discounted cashflow and the violet line is the cumulative cashflow.
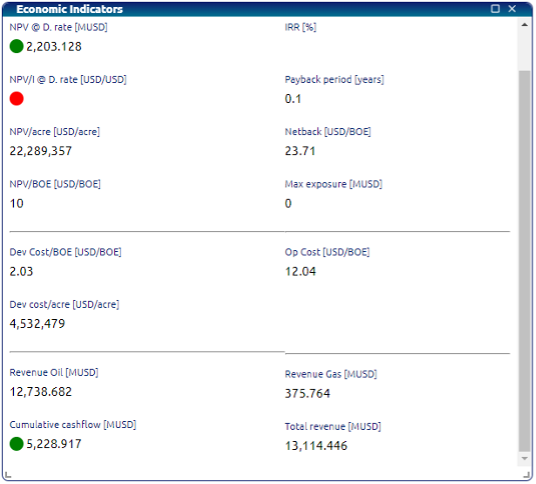
Economic Indicators:
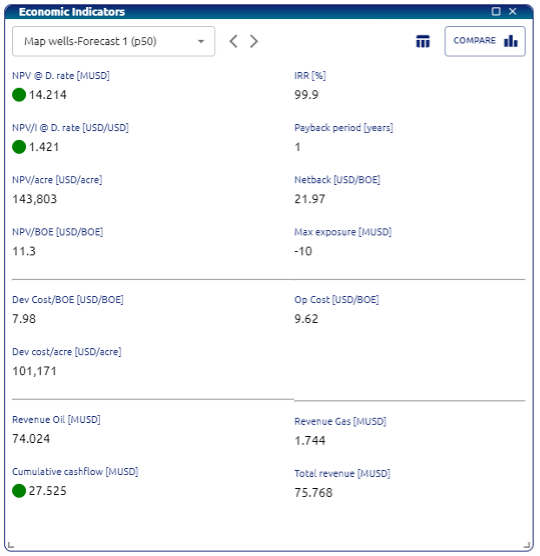
• NPV (Net Present Value): The difference between the present value of cash inflows and outflows over a period over a discount rate.
• IRR (Internal Rate of Return): The discount rate that makes the NPV of all cash flows from the project equal to zero.
• NPV/I (Net Present Value Index): The ratio of NPV to the initial investment, indicating profitability.
• Payback Period: The time it takes for an investment to generate an amount of cash inflows equal to the initial investment.
• NPV/acre: NPV calculated per acre of land.
• Netback: Revenue from oil and gas sales minus production and transportation costs.
• NPV/BOE: NPV per barrel of oil equivalent.
• Max Exposure: The maximum potential loss in the investment.
• Development Cost/BOE: Cost to develop a barrel of oil equivalent.
• Operation Cost USD/BOE: Operating cost per barrel of oil equivalent in USD.
• Development Cost/acre: Cost to develop per acre of land.
• Revenue Oil: Income from oil sales.
• Revenue Gas: Income from gas sales.
• Cumulative Cashflow: Total net cash flow over the project period.
• Total Revenue: Total income from both gas and oil sales.
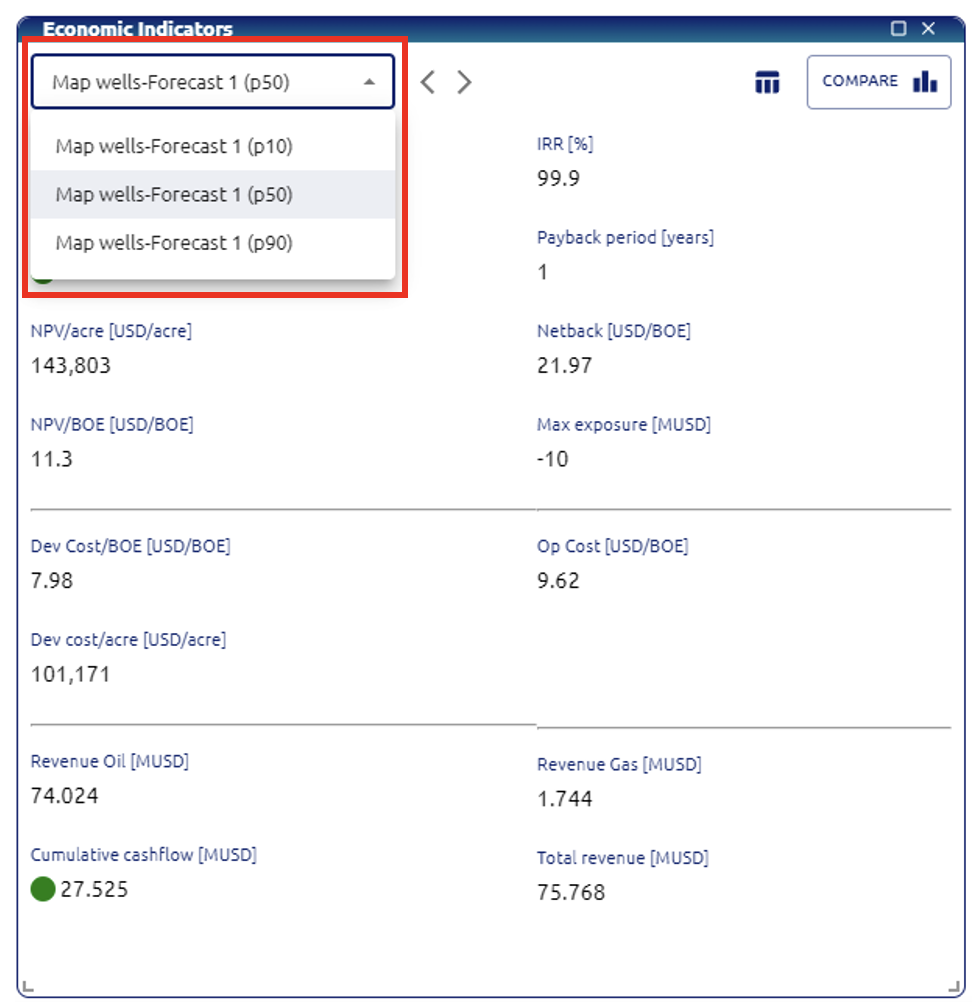
Users can select between the wells of the case
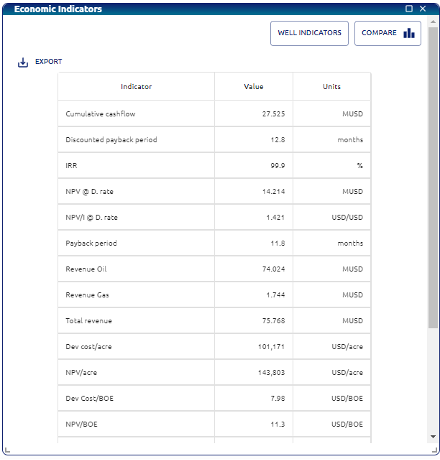
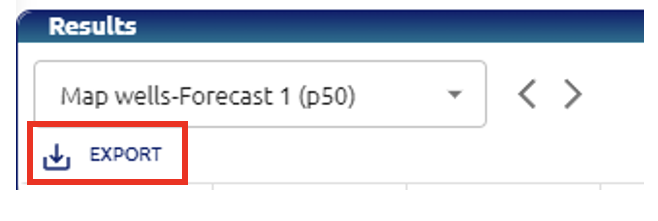
Users can see the results as a table and export it to an excel file
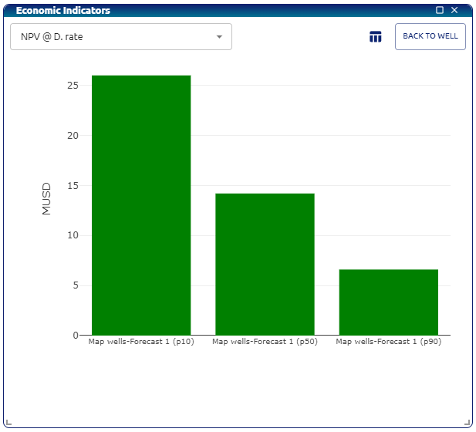
Users may see comparative plots of the main indicators.
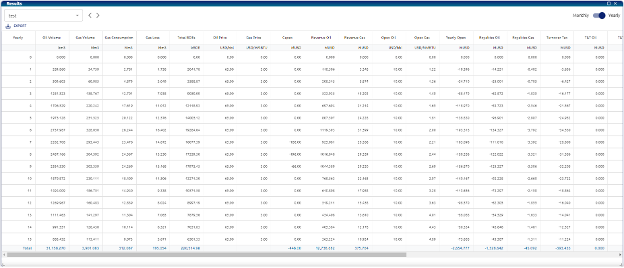
Results Table:
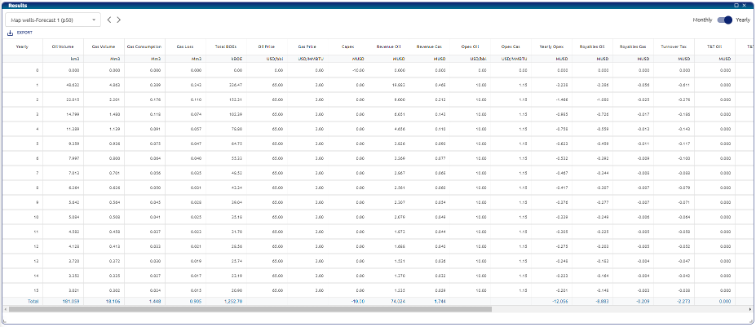
The results table summarizes all the economic evaluation and can be exported to an excel file.
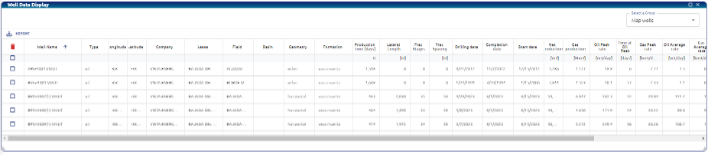
Left Screen ribbon:
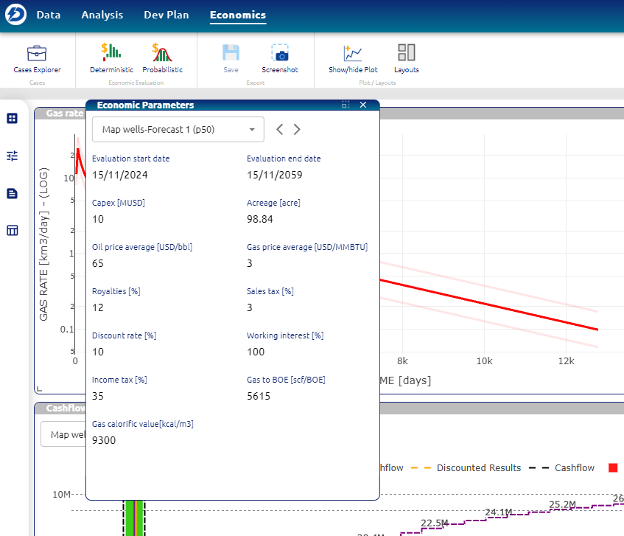
First button activates Results visualization. The second button activates the economic parameters used for the evaluation as shown in image. The third button activates the economic indicators. The last button activates the well data display where all the production data and summary of each of the wells is presented in a table:
Development Plan scenario
In the cases explorer user must create a case and drop the development plan into the case:
The first menu will allow the user to select and modify three main parameters:
• Production start time: date when the production is going to be taken into consideration for the evaluation.
• Evaluation start time: date when the evaluation is going to be calculated from.
• Evaluation end time: date when the evaluation should stop.
User can click on the “eye” button to look into the production curve of the selected well and can switch from oil to gas phase, rate or cumulative.
• Date: date column of the evaluation.
• Time period: period of each step.
• Opex Oil: opex assigned to the oil production [USD/bbl].
• Opex Gas: opex assigned to the gas production [USD/MMBTU].
• Opex Fixed: fixed Opex configurable by user [MMUSD].
• T&T oil: treatment and transportation costs assigned to the oil production [USD/bbl].
• T&T gas: treatment and transportation costs assigned to the gas production [USD/MMBTU].
• Oil price: oil price for each period [USD/bbl].
• Gas price: gas price for each period [USD/MMBTU].
User can use the checkboxes for each variable to apply the same values for all wells.
There are three options to modify each variable:
• Variable: user can load manually the values and/or copy paste.
• Constant: assign a constant value for the variable
• Inflation: assign annual inflation value for the variables initial value.
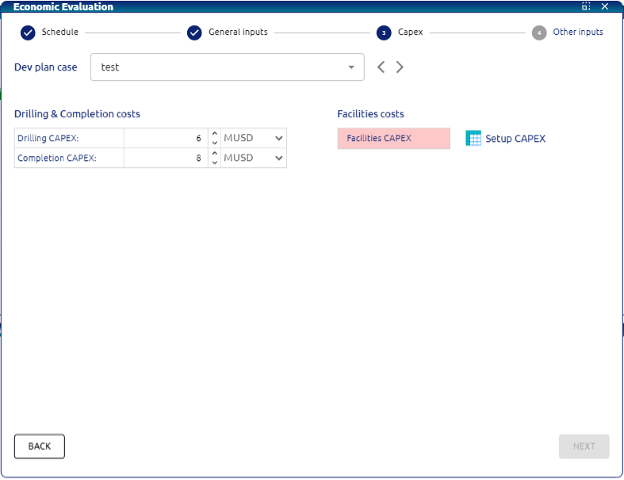
The Capex menu consists of Drilling & Completin costs and the Facilities costs:
CAPEX configuration:
In development plan deterministic economic evaluation the user can now insert capex per feet drilled, capex per fracture or input custom values for each well in the development plan simulated.
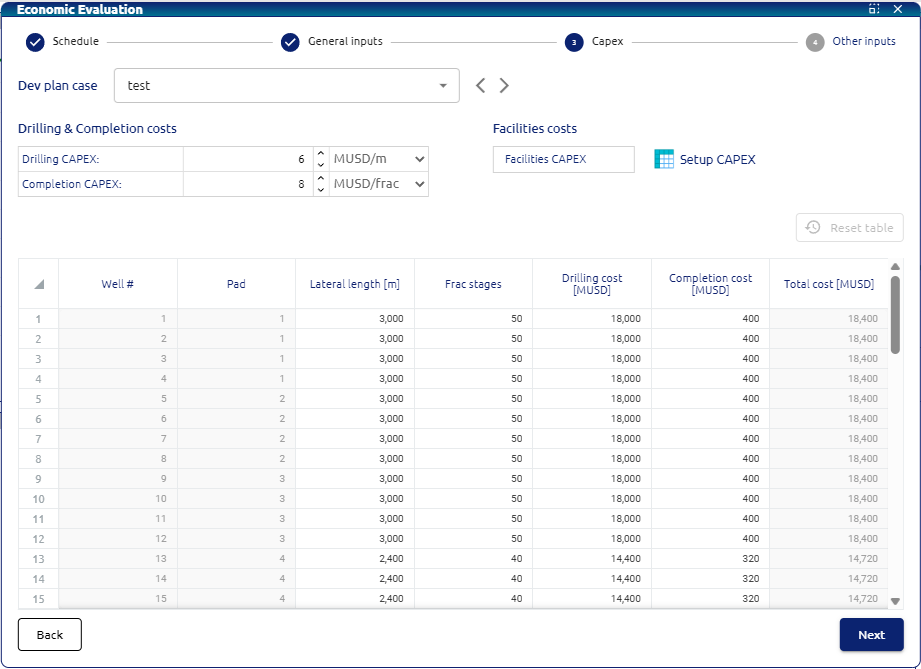
• Drilling CAPEX: CAPEX related to the drilling of a well.
• Completion CAPEX: CAPEX related to the completion of a well.
• Facilities costs: Table where the user can input all the facilities disbursements during the evaluation. User must click on Setup CAPEX.
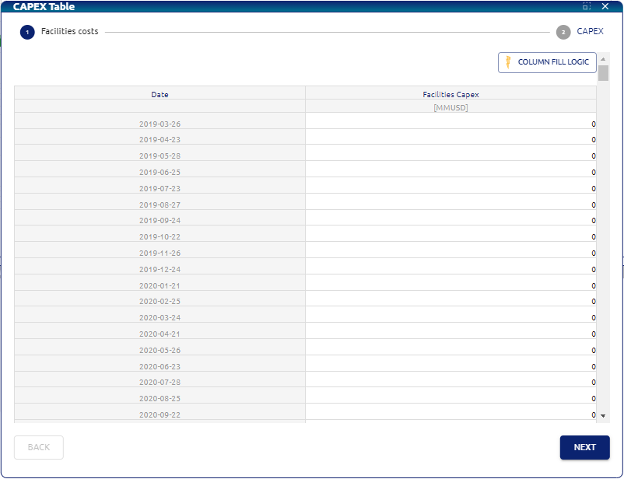
In this menu users can insert the CAPEX for each period of time.
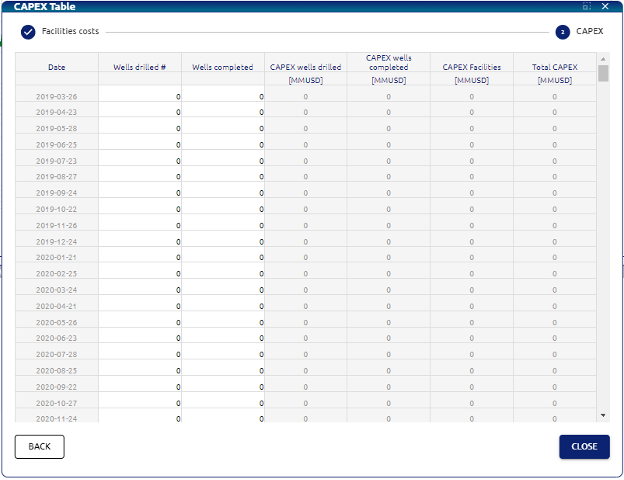
In this menu users can insert the CAPEX for each period of time related to the wells drilled and completed.
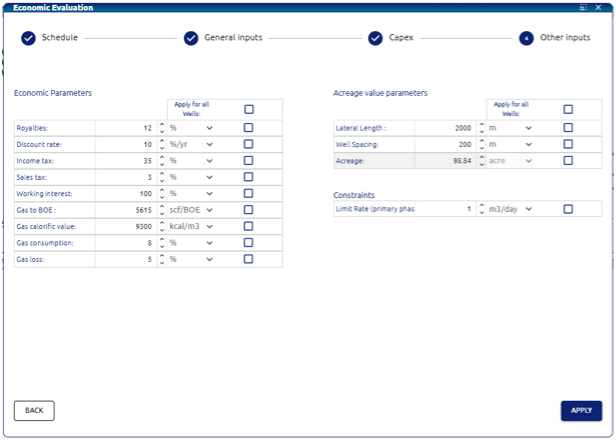
The last menu is the Economic parameters configuration, acreage value parameters and constraints:
• Royalties: Royalties for the case scenario
• Discount rate*: used for the calculation of the discounted cashflow and NPV.
• Income tax: Income tax applied to the scenario.
• Sales tax: Sales tax applied to the scenario.
• Working interest: Working interest of the scenario.
• Gas to BOE: Conversion factor used to calculate BOEs from gas volume.
• Gas calorific value: Rate of conversion for the normalization of gas calorific value.
• Gas consumption: percentage of the produced gas assigned for consumption of the field and is not monetized.
• Gas loss: percentage of the produced gas that is not monetized nor consumed.
• Lateral length: Average lateral length for the wells to calculate an estimated acreage created for each well being evaluated.
• Well spacing: Average spacing for the wells to calculate an estimated acreage created for each well being evaluated.
• Limit rate (primary phase): limit rate for the primary phase for the economic evaluation.
Oil and Gas Layout:
Firstly, the user can see the oil rate and oil cumulative (Oil layout) or the gas rate and gas cumulative (Gas layout)
Cashflow:
The cashflow plot shows a column for each period of time with the cashflow, if the bar is red the value is negative, if it is positive, it is green. There are two lines, the orange line is the cumulative discounted cashflow and the violet line is the cumulative cashflow.
Economic Indicators:
• NPV (Net Present Value): The difference between the present value of cash inflows and outflows over a period over a discount rate.
• IRR (Internal Rate of Return): The discount rate that makes the NPV of all cash flows from the project equal to zero.
• NPV/I (Net Present Value Index): The ratio of NPV to the initial investment, indicating profitability.
• Payback Period: The time it takes for an investment to generate an amount of cash inflows equal to the initial investment.
• NPV/acre: NPV calculated per acre of land.
• Netback: Revenue from oil and gas sales minus production and transportation costs.
• NPV/BOE: NPV per barrel of oil equivalent.
• Max Exposure: The maximum potential loss in the investment.
• Development Cost/BOE: Cost to develop a barrel of oil equivalent.
• Operation Cost USD/BOE: Operating cost per barrel of oil equivalent in USD.
• Development Cost/acre: Cost to develop per acre of land.
• Revenue Oil: Income from oil sales.
• Revenue Gas: Income from gas sales.
• Cumulative Cashflow: Total net cash flow over the project period.
• Total Revenue: Total income from both gas and oil sales.
Economic Parameters:
Results table:
Summary of Economic Calculations for Well Evaluation
General Calculation Flow
The evaluation follows a logical sequence, where each step builds upon the previous one:
- Calculate Income: First, determine how much oil and gas is produced and what it sells for.
- Subtract Expenses: Deduct all costs associated with running the well, like operational costs, taxes, and transportation.
- Determine Profitability: Calculate key profit metrics like EBITDA.
- Factor in Investment & Taxes: Account for the initial investment (CAPEX) and taxes on profits.
- Analyze Cash Flow: Track the actual money moving in and out of the project over time.
- Evaluate the Investment: Finally, use all this information to calculate indicators like NPV and IRR to decide if the project is worthwhile.
Step-by-Step Variable Calculations
Here’s a detailed breakdown of how each major component is calculated.
1. Production Volumes
This is the starting point: measuring how much oil and gas the well produces.
- Production per Period: The system calculates the volume of oil and gas produced in each time period (e.g., each month).
- Formula:
Production in Period = Cumulative Production at End of Period - Cumulative Production at Start of Period
- Formula:
- Total Equivalent Volume (BOE): To simplify analysis, gas volume is converted to its equivalent in barrels of oil (Barrel of Oil Equivalent). This gives a single production figure.
- Formula:
Total Volume (BOE) = Oil Volume (bbl) + Gas Volume (converted to BOE)
- Formula:
2. Revenue (Income)
This is the total money earned from selling the produced oil and gas.
- Oil Revenue:
- Formula:
Revenue_Oil = Oil Volume for Sale (bbl) * Oil Price ($/bbl)
- Formula:
- Gas Revenue: This is slightly more complex because the gas available for sale is what’s left after accounting for gas that is lost or consumed in operations.
- Formula:
Revenue_Gas = Gas Volume for Sale (MMBtu) * Gas Price ($/MMBtu)
- Formula:
3. Investments & Costs
These are all the expenses and are treated as negative numbers because they represent disbursements of the project.
- Capital Expenditure (CAPEX): This is the upfront investment.
- Formula:
CAPEX = - Total Investment Cost
- Formula:
- Operating Expenditure (OPEX): These are the day-to-day costs of running the field.
- Formula:
OPEX_Total = OPEX_Oil + OPEX_Gas + OPEX_Fixed
- Formula:
- Treatment and Transport (T&T): The costs to process the raw product and move it to a point of sale.
- Formula:
T&T Cost = Volume Produced * T&T Rate per unit
- Formula:
4. Taxes and Royalties
These are payments made based on revenue or profit.
- Royalties: A percentage of the revenue paid to the owner of the mineral rights (often the government).
- Formula:
Royalties = Total Revenue * (Royalty Rate % / 100)
- Formula:
- Turnover Tax: A tax calculated on total revenue.
- Formula:
Turnover Tax = Total Revenue * (Turnover Tax Rate % / 100)
- Formula:
- Income Tax (Tax on Profits): This tax is only paid if the project is making a profit in a given period. To calculate it, we first need the “taxable base.”
- Taxable Base Formula:
Taxable Base = EBITDA + DD&A(DD&A is explained below) - Income Tax Formula:
Income Tax = Taxable Base * (Income Tax Rate % / 100)(only if the base is positive)
- Taxable Base Formula:
5. EBITDA (Operational Profit)
EBITDA stands for Earnings Before Interest, Taxes, Depreciation, and Amortization. It’s a key metric that shows the profitability of the well’s core operations, ignoring financial and accounting decisions.
- Formula:
EBITDA = Total Revenue - Total OPEX - Royalties - Turnover Tax - T&T Costs
6. Depreciation, Depletion & Amortization (DD&A)
This is not a real cash expense but an accounting concept. It’s how the large upfront investment (CAPEX) is “spread out” as an expense over the productive life of the well. It reduces the taxable profit.
- Concept: The amount of DD&A for a period is proportional to the amount of oil and gas extracted during that period relative to the total remaining reserves.
- Formula:
DD&A = Current CAPEX Balance * (Volume Produced in Period / Reserves at Start of Period)
7. Cash Flow
This is the bottom line: the actual cash generated or spent in each period. It is the most critical measure of a project’s financial health.
- Cash Flow per Period:
- Formula:
Cash Flow = EBITDA + CAPEX + Income Tax
- Formula:
- Discounted Cash Flow (DCF): This is a crucial adjustment. It recognizes that money received in the future is worth less than money received today (due to inflation and opportunity cost). Each period’s cash flow is “discounted” back to its value in today’s money.
- Formula:
Discounted Cash Flow = Cash Flow_t / (1 + Discount Rate)^t- Where
tis the time period (e.g., month 1, 2, 3…).
- Where
- Formula:
Key Economic Indicators
After all the periodic calculations are done, a set of final indicators is generated to summarize the project’s value.
- Net Present Value (NPV): This is the most important indicator. It is the sum of all future discounted cash flows. It tells you the total profit the project will generate over its entire life, expressed in today’s money.
- Rule of Thumb: If NPV is positive, the project is considered a good investment.
- Internal Rate of Return (IRR): This is the project’s effective rate of return. It’s the discount rate at which the NPV would be exactly zero.
- Rule of Thumb: If the IRR is higher than the company’s minimum acceptable rate of return (the discount rate), the project is attractive.
- Payback Period: The length of time it takes for the project’s cash flows to pay back the initial investment (CAPEX). A shorter payback period is generally better as it means less risk.
- Max Exposure: This represents the biggest negative balance in the cumulative cash flow. In simple terms, it’s the maximum amount of money the project will be “in the hole” before it starts generating positive returns.
- Net Back: A measure of profitability per unit produced.
- Formula:
Net Back = EBITDA / Total Volume (BOE)
- Formula:
Other Important Concepts
Annualization
While calculations are often done monthly for precision, the results are also grouped by year. Most values (like revenue and costs) are simply summed up. Others, like prices or unit costs, are recalculated based on the annual totals to provide a clear yearly overview.
Monte Carlo Simulation
This is an advanced “what-if” analysis. Instead of using single values for uncertain variables (like oil price or CAPEX), the system runs the entire calculation thousands of times. Each time, it uses different values sampled from a probability distribution. This produces a range of possible outcomes (e.g., optimistic, pessimistic, most likely) and gives a much better understanding of the project’s risk.