Skip to content
Dash Documentation
Search
Ctrl
K
Cancel
Select theme
Dark
Light
Auto
Select language
English
Español
1. Introduction
2. Accessing Dash
3. Home
3.1. Introduction
3.2. Projects
3.3. Datasets
4. Data
4.1. Introduction
4.2. Datasets
4.3. Add Visual
4.4. Layouts
4.5. Pages
4.6. Filters Pane
4.7. Visuals Pane
4.7.1. Introduction
4.7.2. Build Visual
4.8. Data Pane
5. Analysis
5.1. Introduction
5.2. Datasets
5.3. Filtering
5.3.1. Introduction
5.3.2. Wells Selection
5.3.3. Well list
5.4. Decline Curve Analysis
5.4.1. Multi Well
5.4.2. Single Well
5.4.3. Normalizations
5.4.4. Type Well
5.4.5. Average
5.4.6. Consolidate
5.5. Dynamic Data Analysis
5.5.1. Introduction
5.5.2. PVT
5.5.3. Convert To BHP
5.5.4. Rate Normalized Pressure
5.6. Correlations
5.6.1. Vaca Muerta Correlation
5.6.2. Correlations
5.7. Analysis Control
5.7.1. Statistics
5.7.2. Results
5.8. Miscellaneous
5.8.1. Compare
5.8.2. Show/Hide Plot
5.8.3. Layout
5.8.4. Screenshot
5.8.5. Well Data
5.8.6. Time Series Display
6. Field Development Plan
6.1. Introduction
6.2. Production Setup
6.2.1. Introduction
6.2.2. Optimizer
6.2.3. Base Production
6.2.4. Type Wells
6.3. FDP Analysis Control
6.3.1. Introduction
6.3.2. Wells Setup
6.3.3. Constraints
6.3.4. Results
6.4. Calculation
6.4.1. Introduction
6.5. Miscellaneous
6.5.1. Introduction
6.5.2. Show/Hide Plot
6.5.3. Layouts
6.6. Export Options
6.6.1. Introduction
6.6.2. XLSX File
6.6.3. Screenshot
7. Economics
7.1. Introduction
7.2. Cases Explorer
7.3. Deterministic Economic Evaluation Tool
7.4. Probabilistic Economic Evaluation Tool
8. Annexe
8.1. Annexe 1
8.2. Annexe 2
Select theme
Dark
Light
Auto
Select language
English
Español
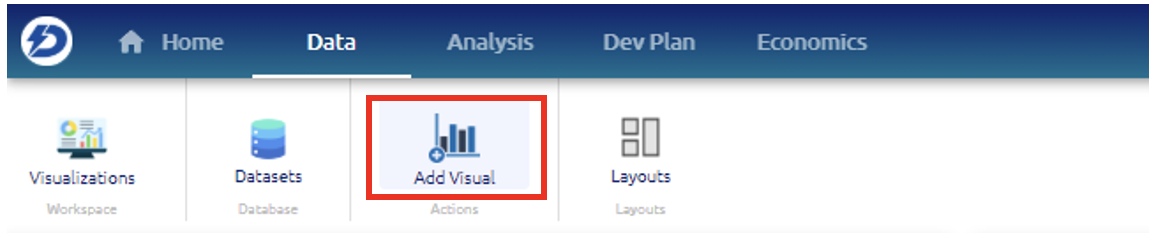
Add Visuals
This shortcut allows the user to create a new visualization and add it to the page his working on.