Single Well
The Single well decline curve analysis feature allows the user to forecast a single well entering the parameters according to the selected decline model. The feature will be located over ‘Analysis’ tab in the navbar, inside ‘Decline Curve Analysis’ section.
 Decline Curve Analysis in the main toolbar
In order to calculate forecasts, it is necessary for the user to select or create a forecast to which to incorporate this result, they must also select a well from the list of wells. This means it is necessary for the Single well DCA feature to have a Wells selection that retrieves the historical data for the selected wells, and a Wells list for displaying/hiding wells.
Single well DCA Menu
 Single well DCA menu
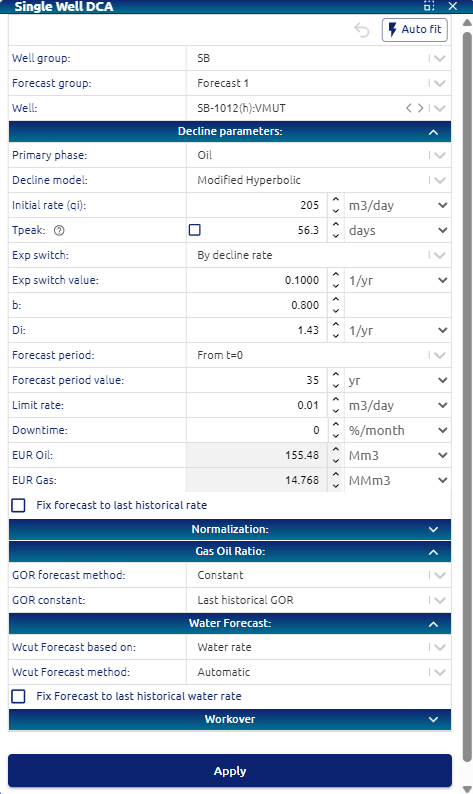
This menu allows the user to set the parameters for the forecast:
• Well group: dropdown for selecting the group of wells to forecast
• Forecast group: text input for setting a name for a group of well forecasts
• Forecast name: text input for setting a name for a forecast
Auto Fit
The lightning icon button should trigger the ‘auto fit’ feature, allowing the user to forecast a well through curve fitting.
Clicking this button should trigger a Multi well DCA forecast. For technical specifications, go to Single well DCA | Auto fit (Multi well DCA)
After clicking the button, the form should be autocompleted and the DCA should be applied (this means we should update the Time series plots).
Decline parameters
• Primary phase: dropdown for selecting multi well forecasts primary phase. Options:
     o Oil
     o Gas
• Decline model: dropdown for selecting multi well forecasts decline model. Options:
     o Exponential (Exp)
     o Hyperbolic (H)
     o Modified hyperbolic (MH)
     o Power law exponential (PLE)
     o Stretched exponential (SE)
• b: b factor value for H / MH decline models
• Di min / Di max: initial decline rate value for H / MH / Exp decline models
• Exponential switch: dropdown for selecting switch method from hyperbolic to exponential for MH decline model. Options:
     o By time (days)
     o By decline rate (1/yr)
• Exp switch value: input number for setting exponential switch decline rate or time for MH decline model
• n: n exponent value for PLE / SE decline models
• Decline rate at t=inf: decline rate at infinite time for PLE decline model
• Forecast period: input number for selecting years to forecast. Period time dropdown to set forecast time. From t=0, from last historical data, until fixed date and from peak rate.
• Limit rate: input number for selecting minimum limit rate for the forecast
• Downtime: input downtime in % or days per month for the forecast.
• Fix forecasts to last historical rate: checkbox for applying vertical shifting to rates curves to make them pass over last historical rate
• EUR Oil; Oil Estimated Ultimate Recovery value for the well after the forecast has been made
• EUR Gas; Gas Estimated Ultimate Recovery value for the well after the forecast has been made
Normalization
• Frac stages: checkbox and input number for applying forecasts rates normalization by frac stages
• Lateral length: checkbox and input number for applying forecasts rates normalization by lateral length
Gas oil ratio
• GOR forecast method: dropdown for selecting GOR forecasting method. Options:
     o Manual
     o Constant
     o Automatic
• GOR input values: input numbers for setting ‘Manual’ / ‘Constant’ GOR forecasting
Water cut
• Wcut forecast method: dropdown for selecting Wcut forecasting method. Options:
     o Manual
     o Constant
     o Automatic
• Wcut input values: input numbers for setting ‘Manual’ / ‘Constant’ Wcut forecasting
Once the user has configured the Single well DCA parameters from the menu and clicked ‘Apply’, the calculated forecast will impact on:
• Map
• Time series plots
• Time series display table
• Well data display table
• Statistics
• Results table
Workover
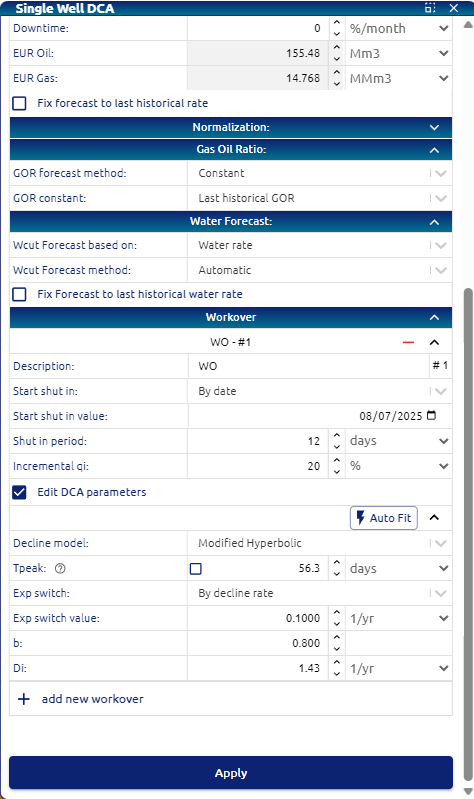
This option allows the user to create a shut in at a determinate time in the future of the well and then after shut in user can configure an incremental initial rate and also its decline. User can change the decline model and parameters individually. There is no limit on the ammount of shut ins that the user can configure.
Parameters to define: • Description: Name of the shut in. • Start of shut in: by date, by production time differential and production time cumulative. • Shut in period: days, months years of shut in. • Incremental qi: user can define a % of incremental qi.
If the user selects “Edit DCA Parameters”, all decline parameters will be available for the user to edit.