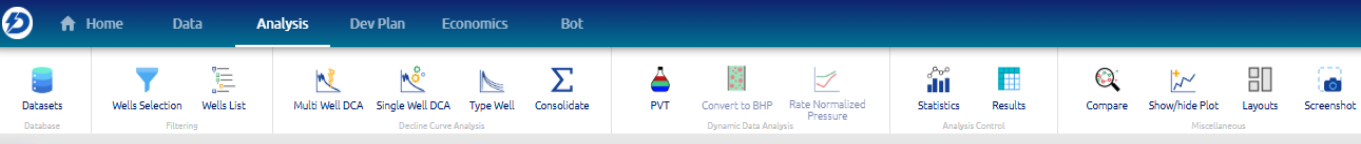
Show/Hide Plot
This feature allows the user to show and hide the plots in the main screen of the Analysis module.
Main window:
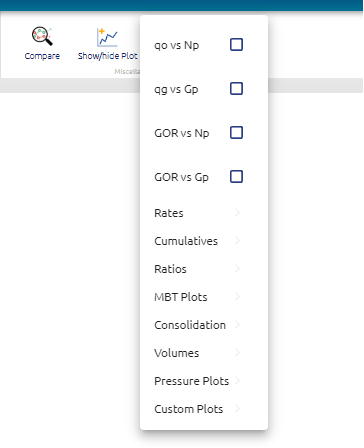
User can click on the checkbox to activate the plot and show them on the main screen. User can also create custom plots:
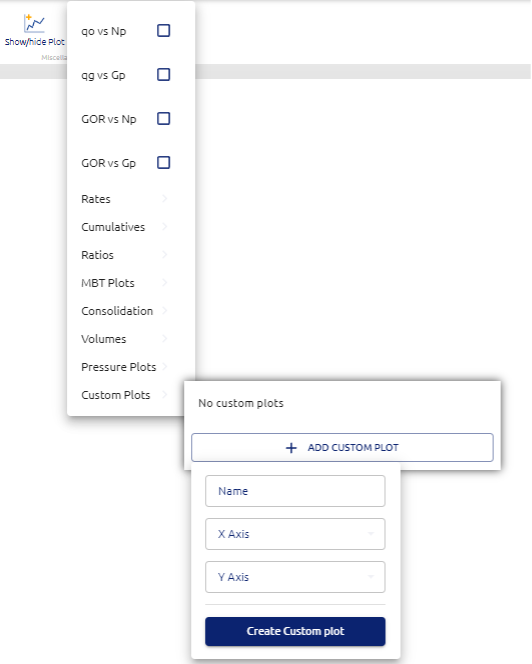
User can select the title of the plot and which variable to put into the x and y axis.
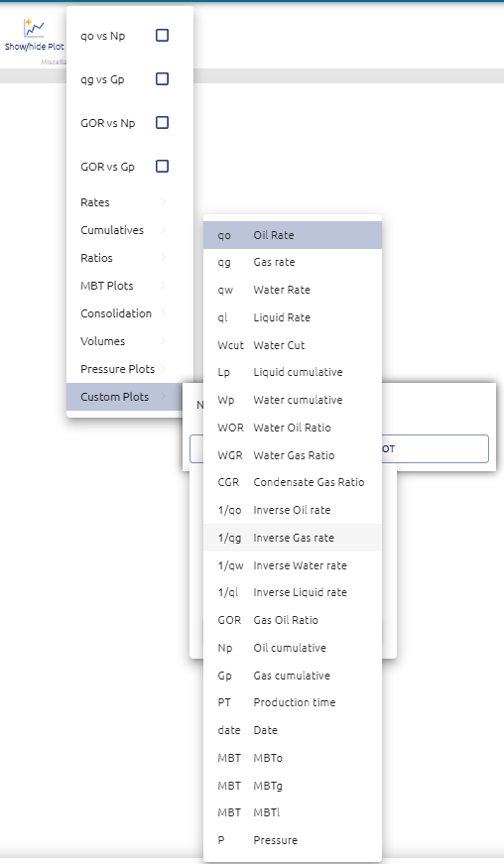
This plots added to the layout can then be saved on a custom layout to allow the user to have his own set of plots to work on data.