Statistics

This feature allows the user to analize the statistics of the wells selected, it consists of five tabs:
• Completion parameters
• Production parameters
• Forecasts variables
• Results
• Correlations
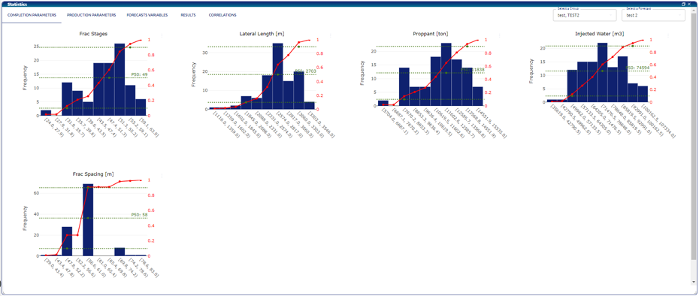
Completion parameters consists of histograms of the following parameters:
• Fracture stages
• Lateral length
• Proppant
• Injected water
• Fracture spacing
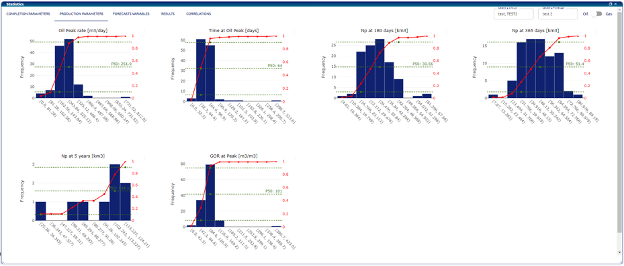
Production parameters consists of histograms of the following parameters:
• Peak reate
• Time at peak
• Cumulative at 6 months of production
• Cumulative at 12 months of production
• Cumulative at 5 years of production
• GOR at peak
These plots are both for oil and gas. User can select a toggle to switch between them.
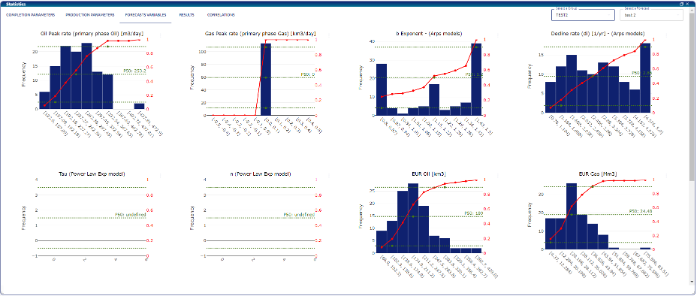
Forecasts variables consists of histograms of the following parameters:
• Peak reate (oil and gas)
• Time at peak
• b factor (Arps models)
• R² (curve fit indicator)
• Decline rate (Di) (Arps models)
• Tau (Power law exponential model)
• N (Power law exponential model)
• EUR (Oil and gas)
• TRR: Technically Recoverable Resources (Oil and gas). It is calculated like TRR_oil = EUR_oil - Np ; TRR_gas = EUR_gas - Gp
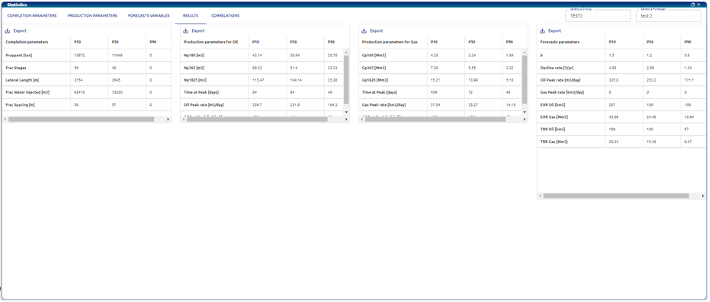
Results contains one table with the statistical summary of the previous tabs. These tables can be exported to an Excel file.
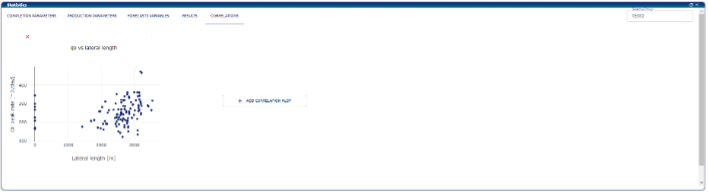
In the correlations tab user can create custom plots selecting variables and parameters calculated or in the data base to look for correlations between them.